Use the GUI
Interface |
Command |
|---|---|
|
|
|
Desktop (default)
pqenalyzer simulation.en
pqenalyzer gui simulation.en is equivalent. A local graphical display is required.
After the window is built, the terminal shows the loaded dataset and how to stop it:
PQEnalyzer  Desktop
Data   5,000 rows / 1 file
Stop   Close window / Ctrl+C
The default --log-level info reports when the desktop is ready and closed.
Use --log-level warning or --log-level error for less output.
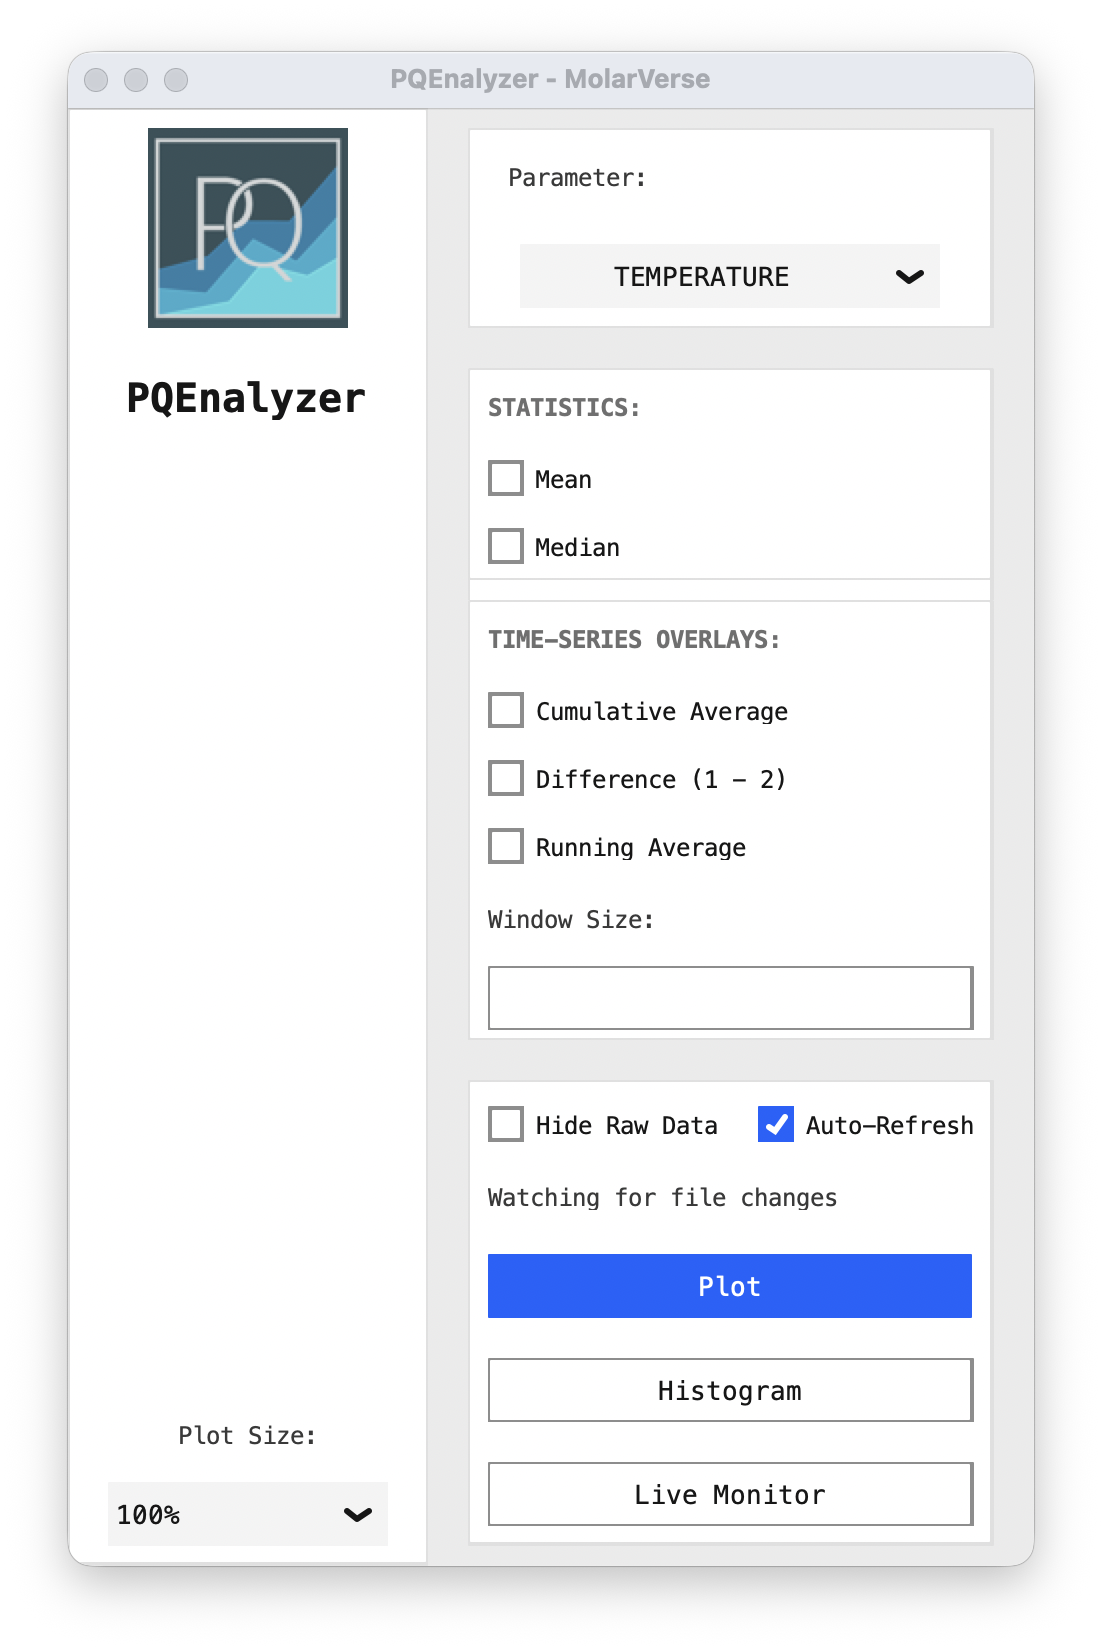
Choose Parameter, select any overlays, then open a plot window.
Control |
Action |
|---|---|
Parameter |
Choose the quantity to plot |
Plot / Histogram |
Open a separate time-series or distribution window |
Statistics / Time-series overlays |
Choose guides before plotting, or click an existing plot to edit it |
Live Monitor |
Open the grid; double-click a panel to focus it; |
Auto-Refresh |
Reread the last input file and update open plots |
Plot Size |
Scale plot text; drag a plot window’s edge to resize it |
Desktop raw series and KDEs keep files separate; statistic overlays pool the files. Difference (1 − 2) subtracts file 2 from file 1 at matching time or step values, with exactly two files and no interpolation.
Browser
pqenalyzer web simulation.en
1. Choose a quantity
Click a dashboard tile, or search with Ctrl+K (Cmd+K on macOS).
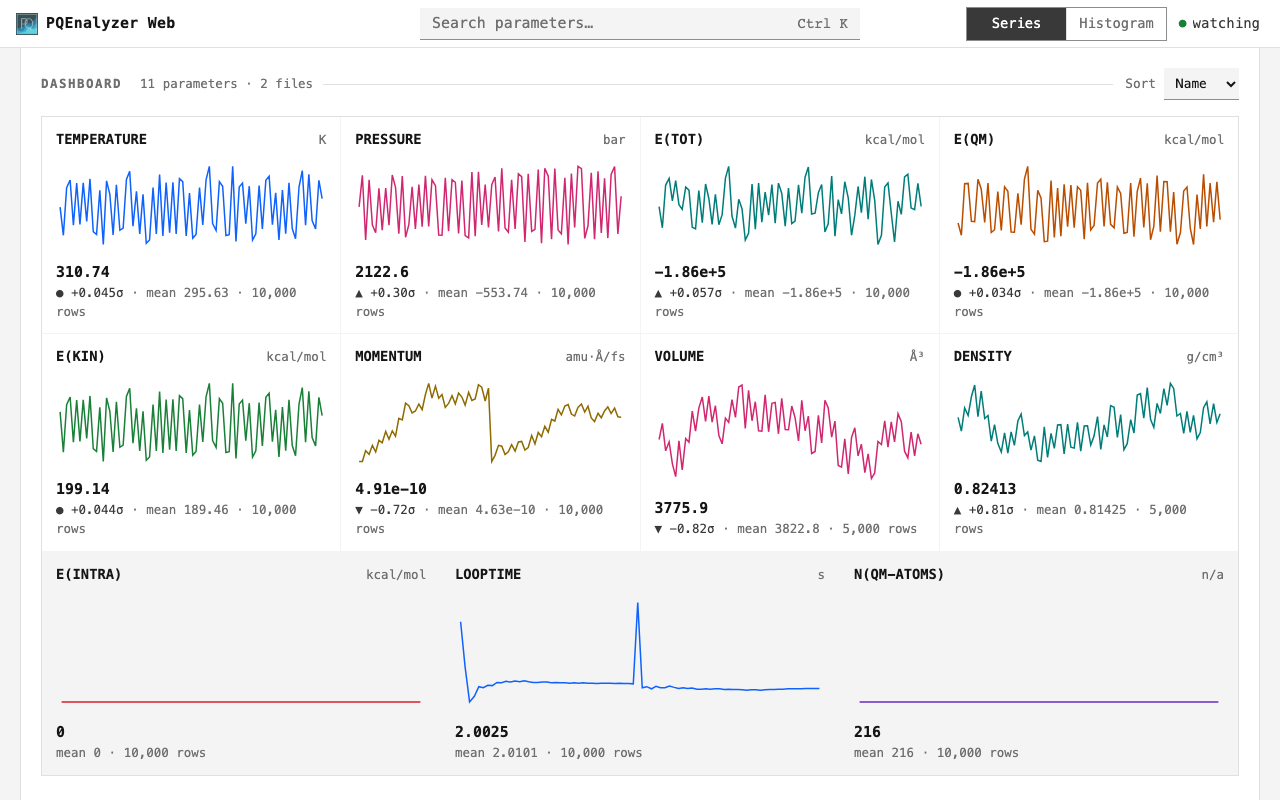
2. Inspect the series
Hover for values. Drag to zoom; double-click to reset. Open Analysis to select a mean, average or autocorrelation.
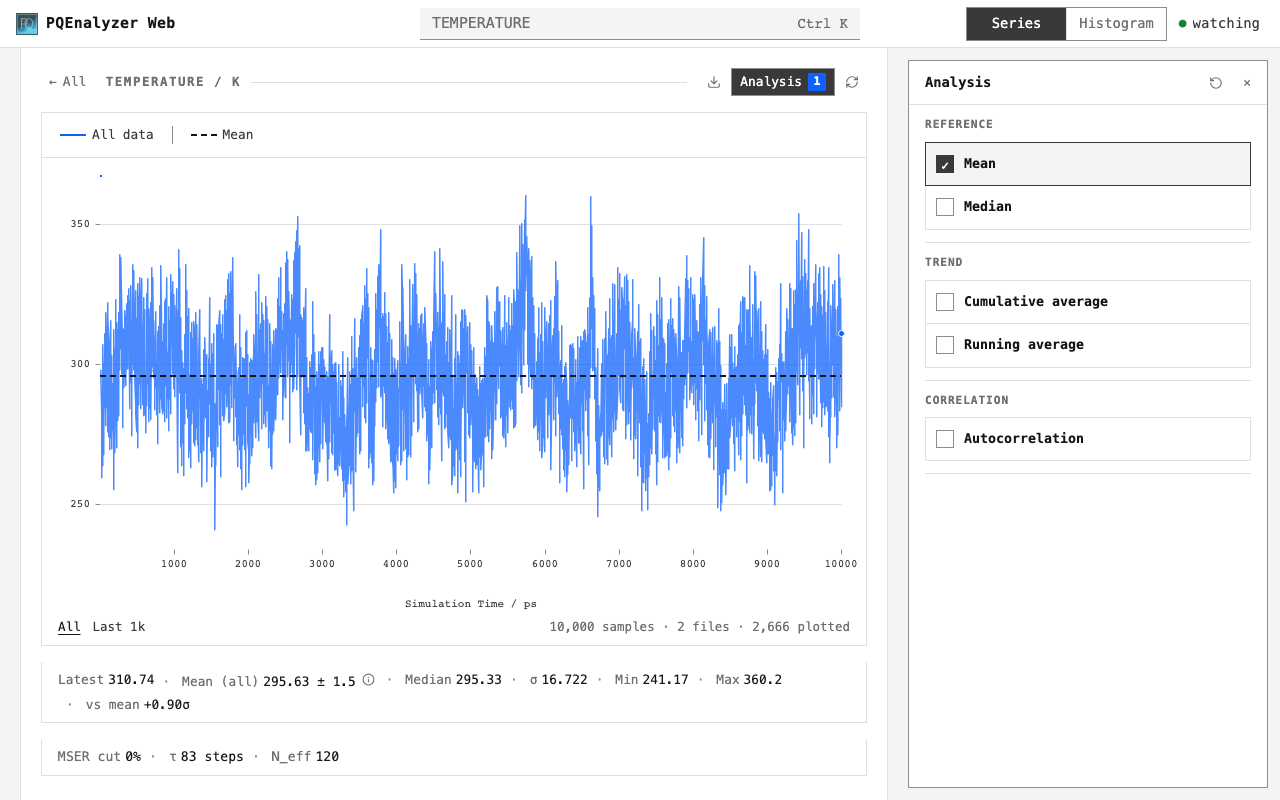
Mean (all) includes every finite value. Its ± is the estimated standard error.
Autocorrelation shows the sequence correlated with itself, against lag in samples.
The MSER cut is a proposed transient boundary; summaries still use all data.
Method definitions.
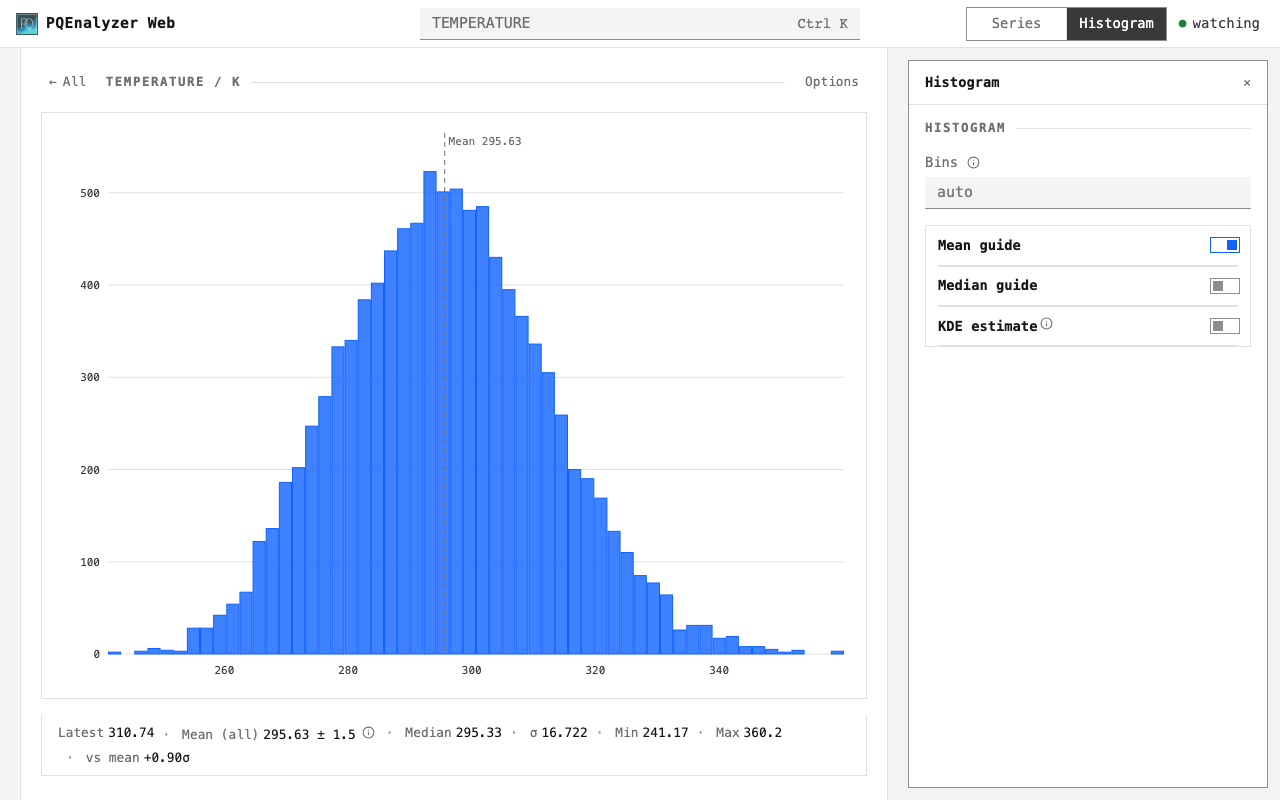
3. Inspect the distribution
Choose Histogram. Options controls bins, reference lines and KDE.
Control |
Action |
|---|---|
All / |
Return to the dashboard; first |
Series / Histogram, or |
Change chart type |
Analysis / Options, or |
Show chart controls |
Left/Right arrows, |
Inspect a focused chart without a mouse |
Watching indicator |
Pause or resume file updates |
Download icon (Series) |
Save the chart as PNG |
|
Show all shortcuts |
Install and open
Python 3.10+. In a new environment:
python3 -m venv .venv
source .venv/bin/activate
python -m pip install PQEnalyzer
Keep simulation.info beside simulation.en. Browser mode opens
http://127.0.0.1:8766. In the browser, multiple files form one dataset in command-line order:
pqenalyzer web md-01.en md-02.en
No file conversion is needed.
Server startup
pqenalyzer web --no-open simulation.en
Once the server is ready, an interactive terminal shows the PQEnalyzer wordmark, version, browser address, dataset size and stop key. Redirected standard output keeps the same facts in a compact four-line form:
PQEnalyzer  Web
Data   5,000 rows / 1 file
Open   http://127.0.0.1:8766
Stop   Ctrl+C
Open the printed URL; --no-open skips opening a browser automatically.
Keep the terminal running. Press Ctrl+C to stop the server.
The heading and URL use the PQ accent in a capable terminal. NO_COLOR=1
disables color; redirected output and TERM=dumb are plain.
At the default --log-level info, the terminal reports only useful server
and data transitions:
15:22:03 INFO    Server ready.
15:24:10 INFO    Input data changed on disk.
15:24:10 INFO    Refreshed 5,020 rows / 1 file.
15:30:00 INFO    Server stopped.
Routine status checks and browser requests stay quiet. Use --log-level warning or --log-level error for less output. --log-level debug adds
Uvicorn diagnostics and HTTP access records when troubleshooting.
Use --port 8767 for a different port. On a cluster or home VPN, use the
SSH / VPN guide.