Viewer guide
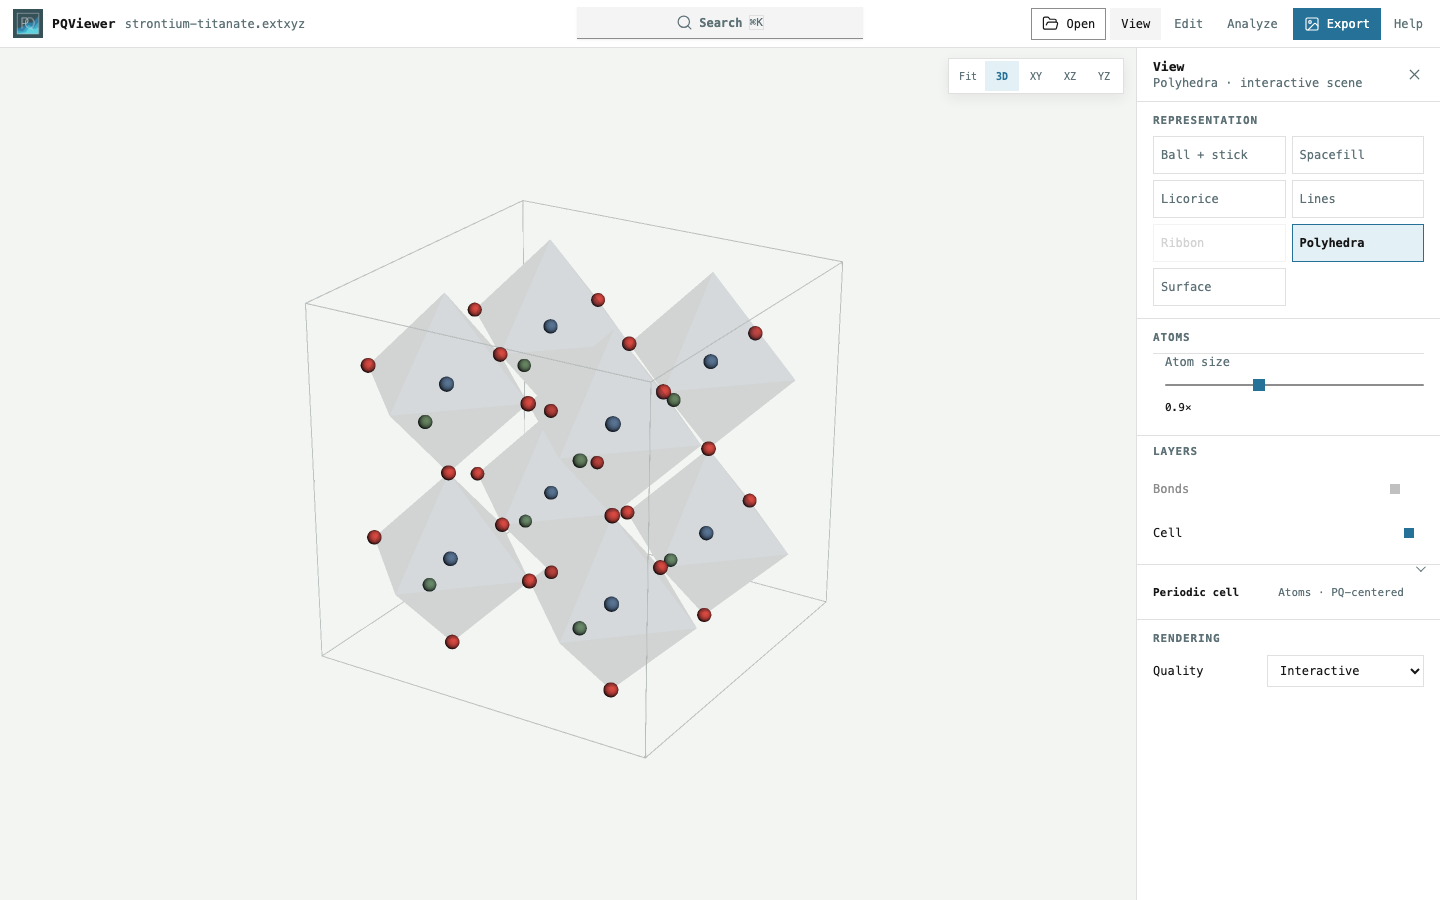
Find a control
Control |
Use |
|---|---|
Open |
Load a file from your desktop |
View |
Representation, layers, atom size, and periodic display |
Edit |
Atom coordinates, elements, and cell |
Analyze |
Atom properties, measurements, and trajectory analysis |
Export |
Figure dimensions, format, and recipes |
Search |
Find atoms, settings, and commands |
On narrow screens, Tools opens the inspector sheet; its arrow expands it. In short landscape windows, the inspector sits beside the canvas.
Measure in order
Click the first atom.
With Analyze open, press
Shift+Tabto focus the molecular canvas.Use
↑/↓to browse atoms, thenEnterto add each atom in order. PressingEnteron a selected atom removes it.Choose Plot to follow the measurement through the trajectory, or Pin to keep it for recall.
Ordered atoms |
Measurement |
|---|---|
2 |
Distance (Å) |
3 |
Angle (°) |
4 |
Dihedral (°) |
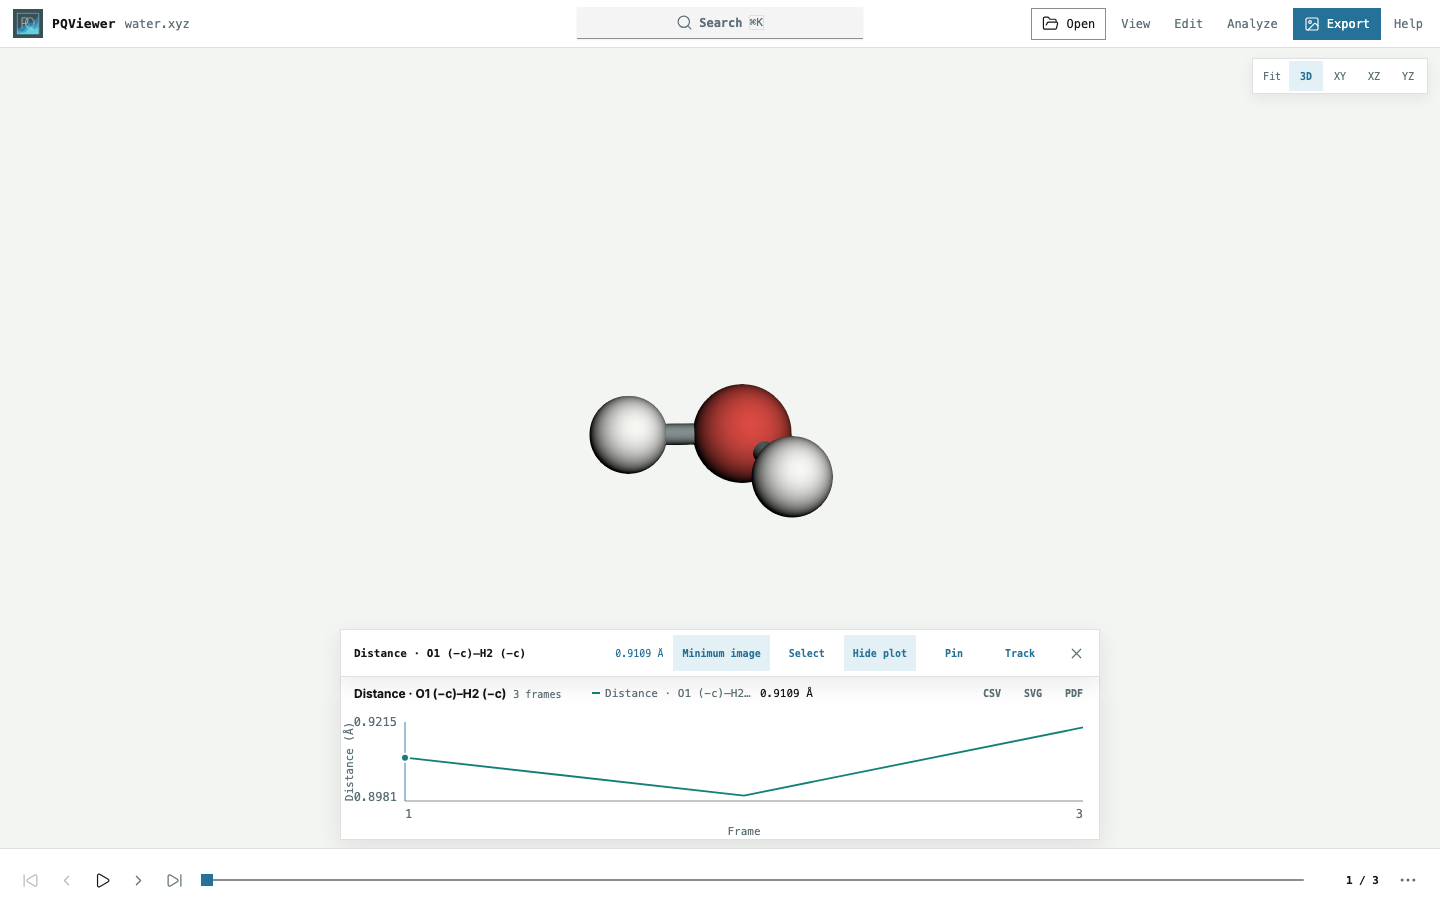
This synthetic water trajectory has the cell hidden. Periodic measurements use the exact minimum image by default; switch to displayed images to measure a chosen replica. Plot cursors follow the displayed frame; clicking a plot point returns to that frame. See trajectory analysis for pair distributions, coordination, and normalization.
One selected atom shows its position and available charge, force, and velocity. Groups show formula, centroid, extent, and unique-atom count. The selection bar offers Select for element, molecule, residue, connected-component, or distance-based groups, and Track for recent atom paths.
Change the display
View offers the representations and layers supported by the source. Unavailable representations explain their requirements on hover, focus, or selection. Periodic cell contains wrapping, centering, and repeats; Rendering controls interactive quality.
Coordination polyhedra depict visible bonding topology, using the nearest distance shell when bonds are inferred. Planar shells become polygons; transition-metal sites are preferred when several metal types are present. Polyhedra protruding outside one displayed cell are omitted; dense structures show a deterministic subset. This display is not a coordination-number analysis.
A single displayed cell omits minimum-image bonds through its boundary. Repeats retain bonds between neighboring displayed cells. Display operations preserve source coordinates; Search → Source coordinates shows stored positions. See cell and wrapping conventions for centred, low-rank, and vacuum cells.
The interactive view uses bundled 3Dmol; if initialization fails, it falls back to the publication renderer. Figure export uses a separate renderer.
Edit the structure
Open Edit or press E.
Edit |
Scope |
|---|---|
Element identity |
Whole structure |
Cartesian coordinates |
Displayed frame |
Cell lengths/angles or 3 × 3 vectors |
Cartesian positions stay fixed by default |
Keep fractional positions |
Scale atoms with the edited lattice |
Periodic axes |
Enable each axis separately |
For a molecule without a source cell, the editor suggests a centred orthorhombic cell from its coordinate extent. Apply it explicitly to create a cell. Changes are local and reversible. Download current frame writes EXTXYZ with lattice and periodic-axis information.
Follow a trajectory
The timeline provides stepping, playback, scrubbing, and the current frame. Its menu holds playback settings, bookmarks, a reference frame, supplied scalar plots, displacement vectors, and supported pair-distribution analysis. Track displays the current atom positions and up to 50 previous frames.
Selections, pins, bookmarks, and references belong to the current workspace. Opening another dataset resets them; reloading the browser also clears them. Up to eight measurements, twelve bookmarks, and sixteen atom-image selections can be tracked at once.
Measurement and scalar plots follow the current frame. Pair-distribution and coordination plots aggregate frames; see trajectory analysis.
Search and shortcuts
Press Cmd/Ctrl+K or / to search. Type, use ↑ / ↓, then Enter.
Settings results show their location, open the inspector, and highlight the
control. Try atom color, edit lattice vectors, or transparent image.
Keys |
Action |
|---|---|
|
Previous / next frame |
|
Back / forward ten frames |
|
Play / pause |
|
Fit structure |
|
3D / XY / XZ / YZ |
|
Edit / View |
|
Toggle cell |
|
Full shortcut sheet and optional Vim navigation |
For exports, see Figures and recipes.